

I started mapping what I knew if the design process already on the team. From working on different projects with different stakeholders, I had a unique perspective at parts of the process but there were evident gaps. Diverging from observations to basic needs on a design team, I expanded the steps and stages into addition mappings.
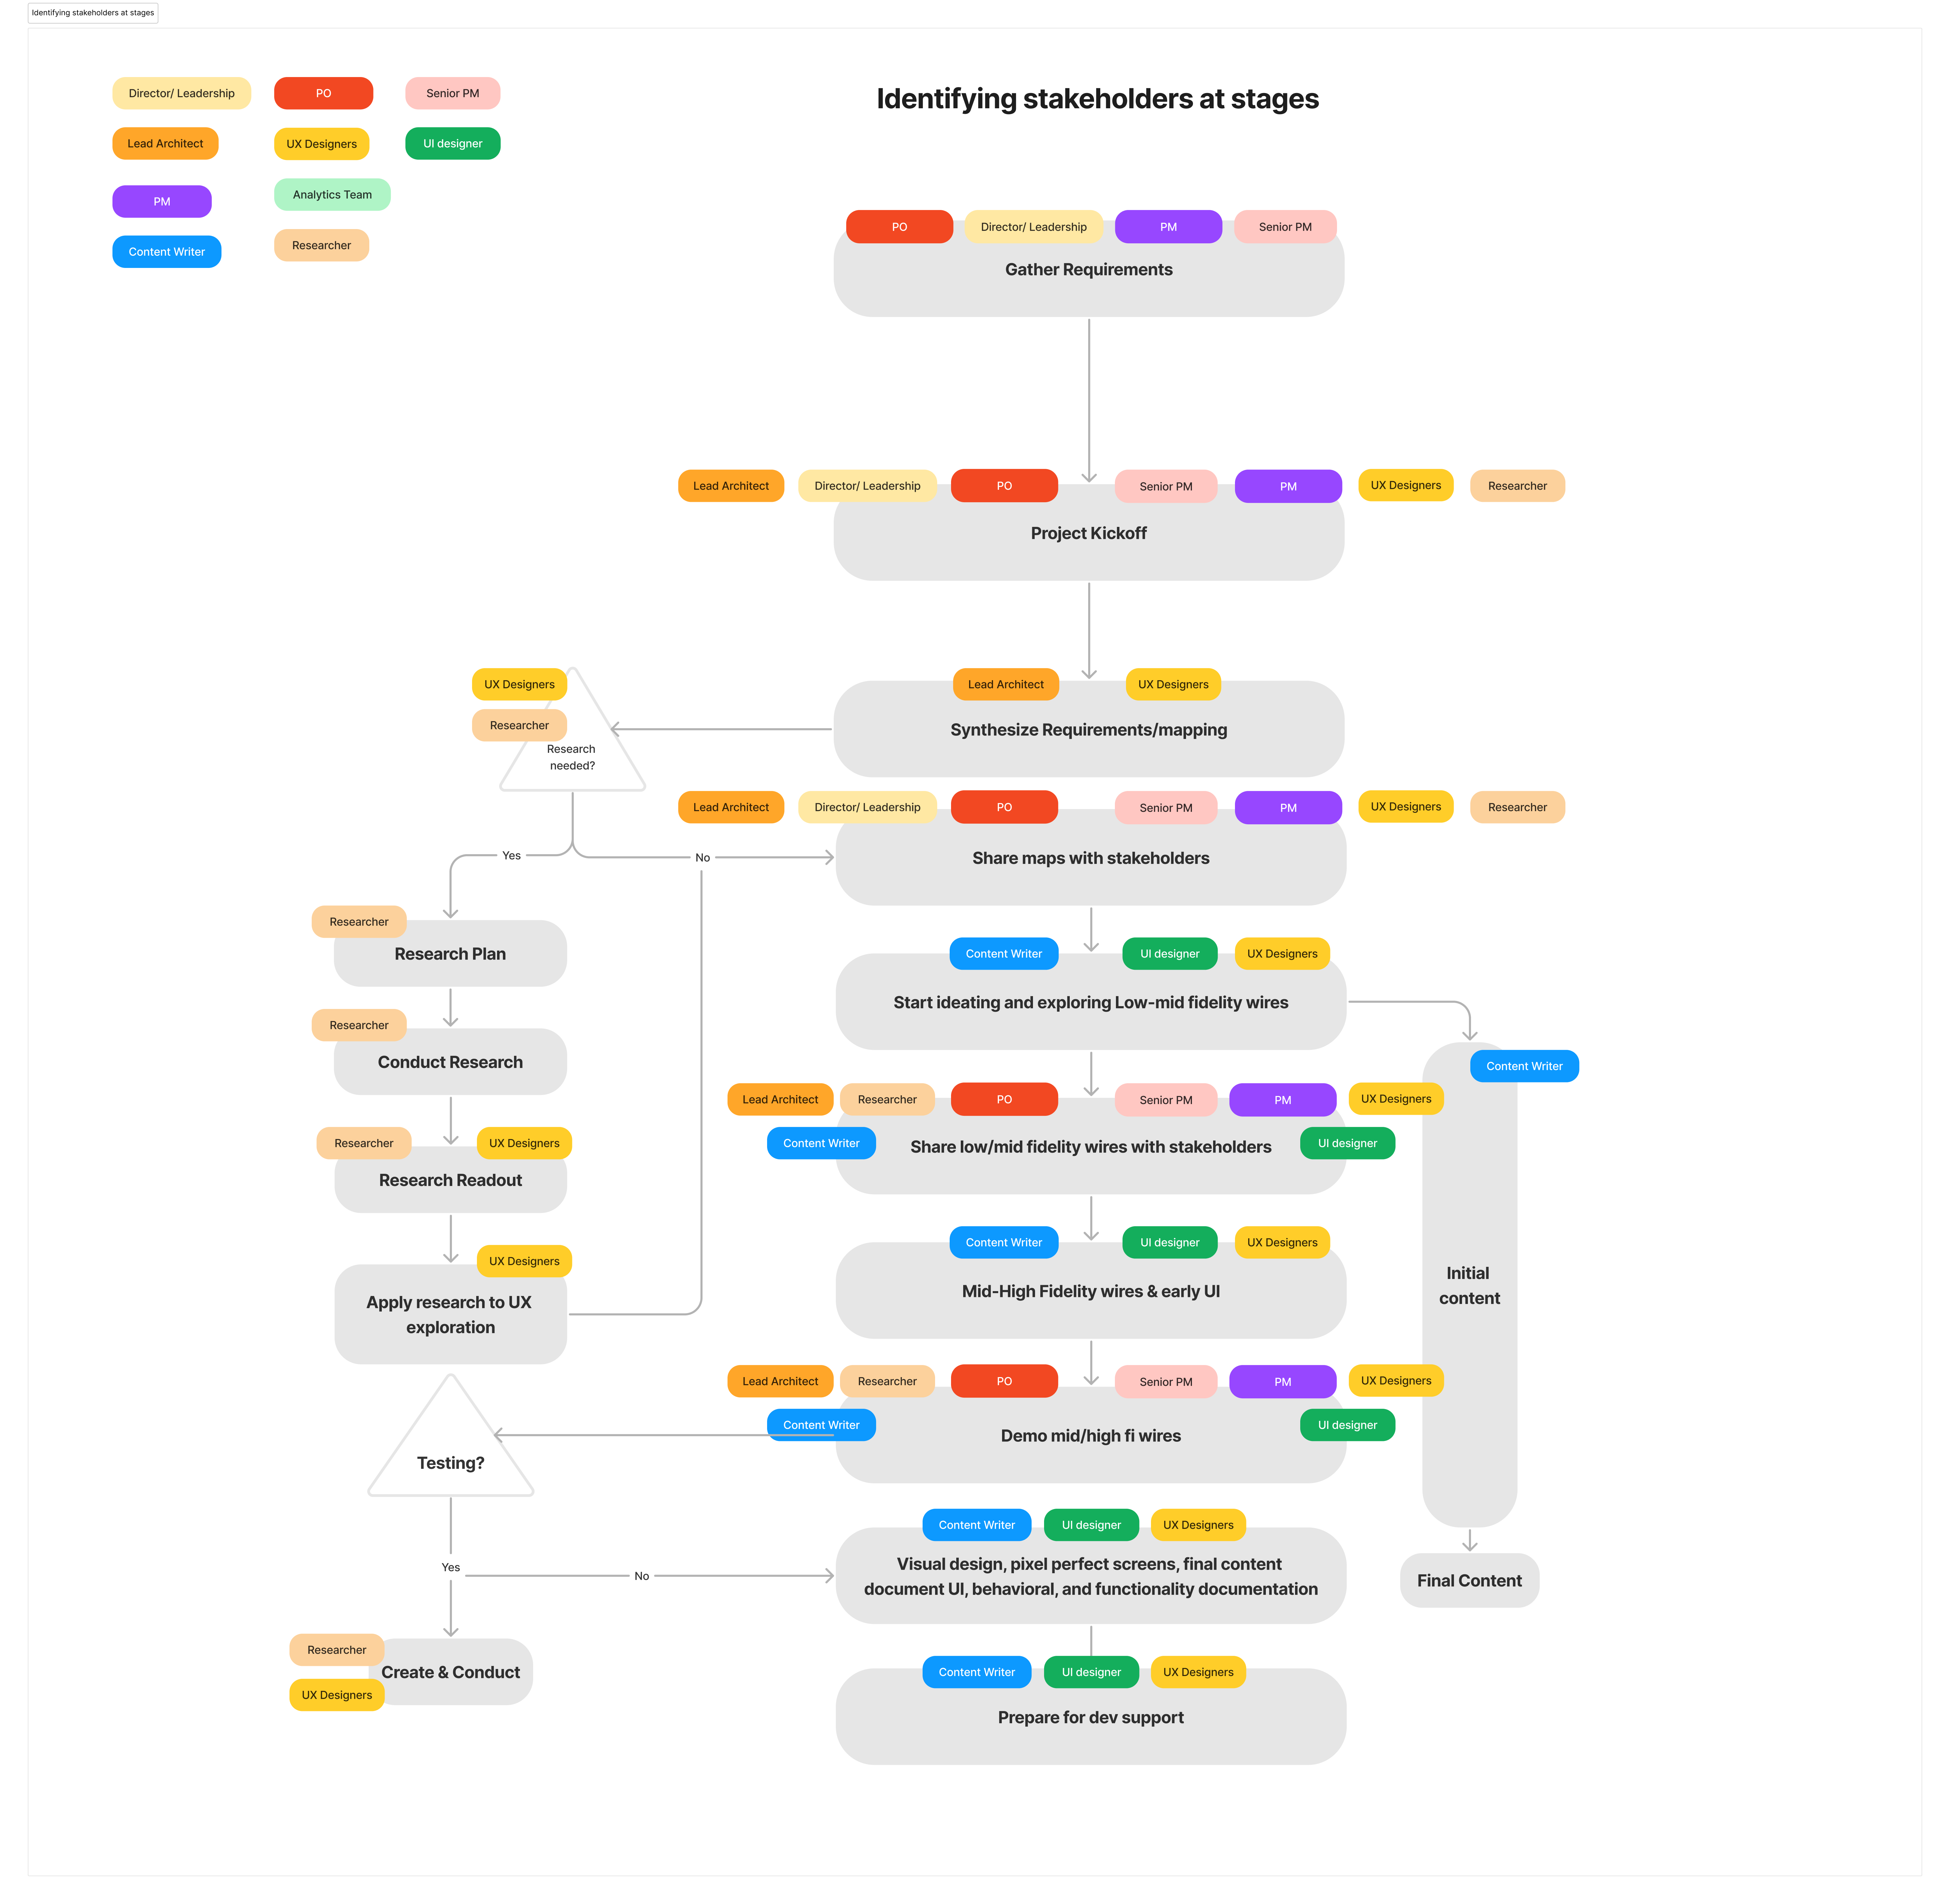
I needed to look at who plays a role where and why in each part of the process. I looked at all the possible stakeholders I've interacted with and seen in meetings. Mapping this allowed me to dive deeper into the smaller steps of the larger stages.
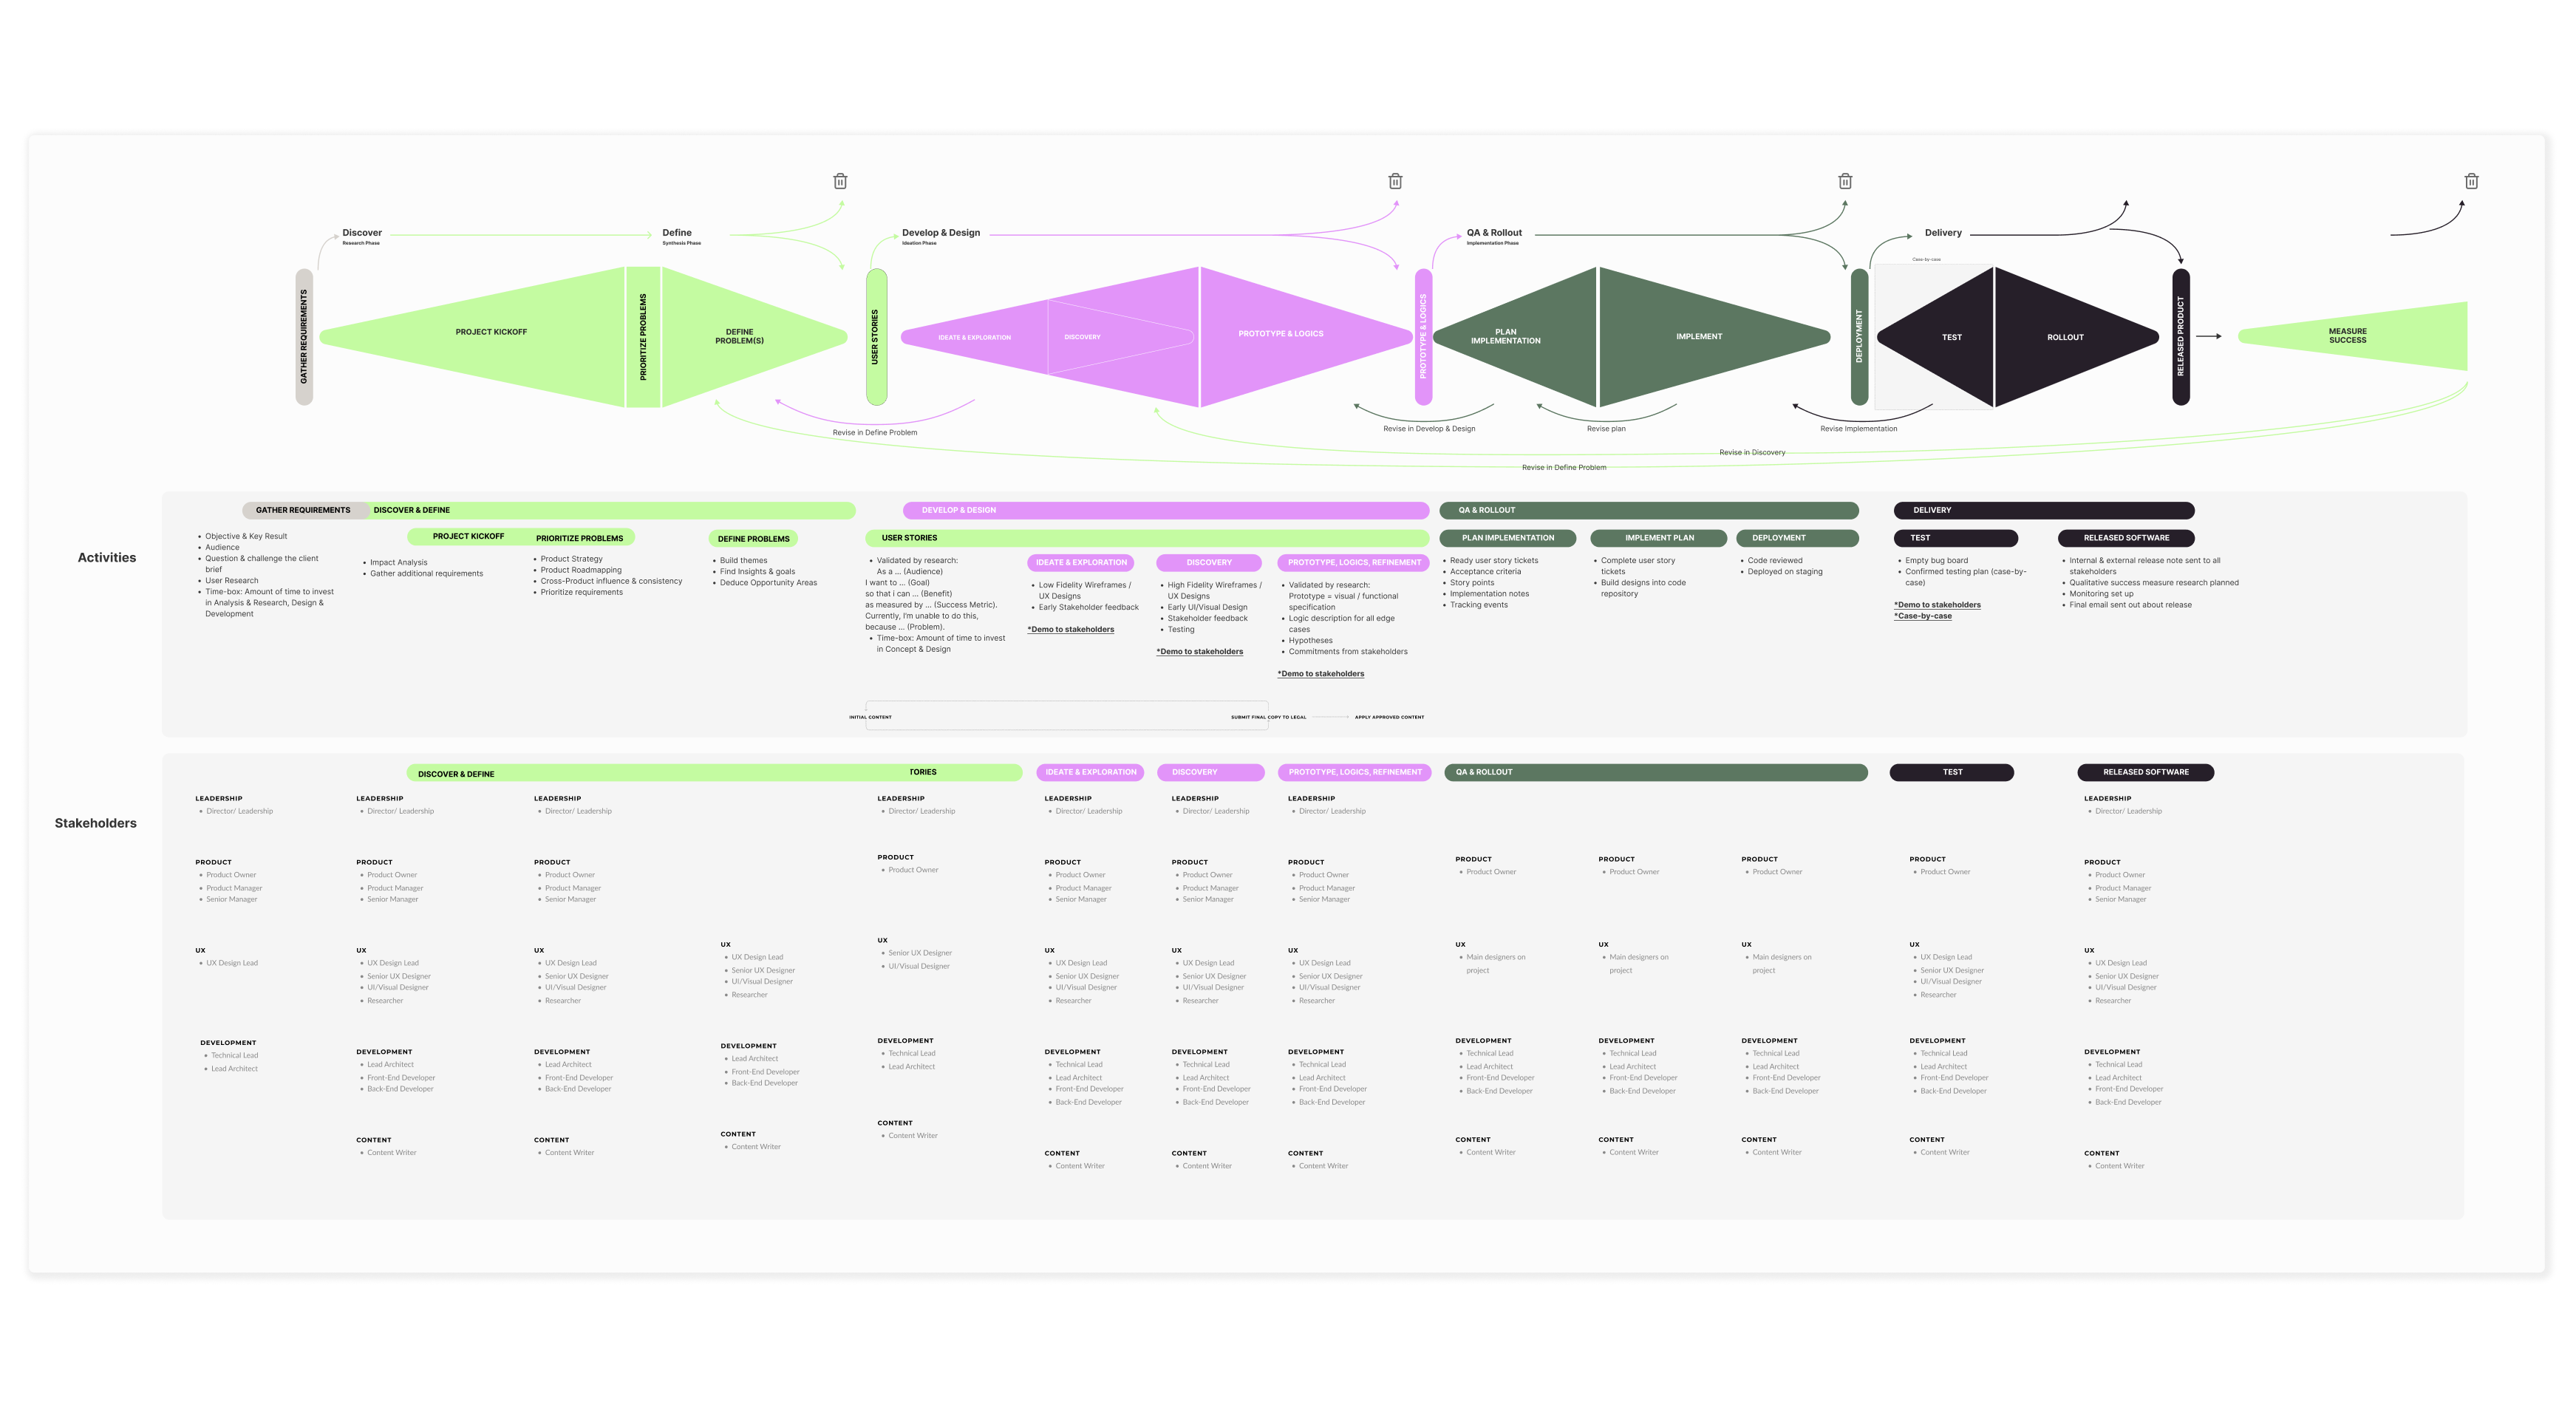
Diverging, converging, and constant iteration that can cycle depending on the project. This brought me to creating a multiple diamond approach showing where we habitually diverge and converge. To support the diamonds, I tied the colors of the diamonds to actionable activities and who is involved in that stage of the diamond. Adding a visual to the blueprint was helpful for some stakeholders but was not effective in communicating jobs-to-be-done or locating what phase a designer was in. This brought me to explore more of a process blueprint.
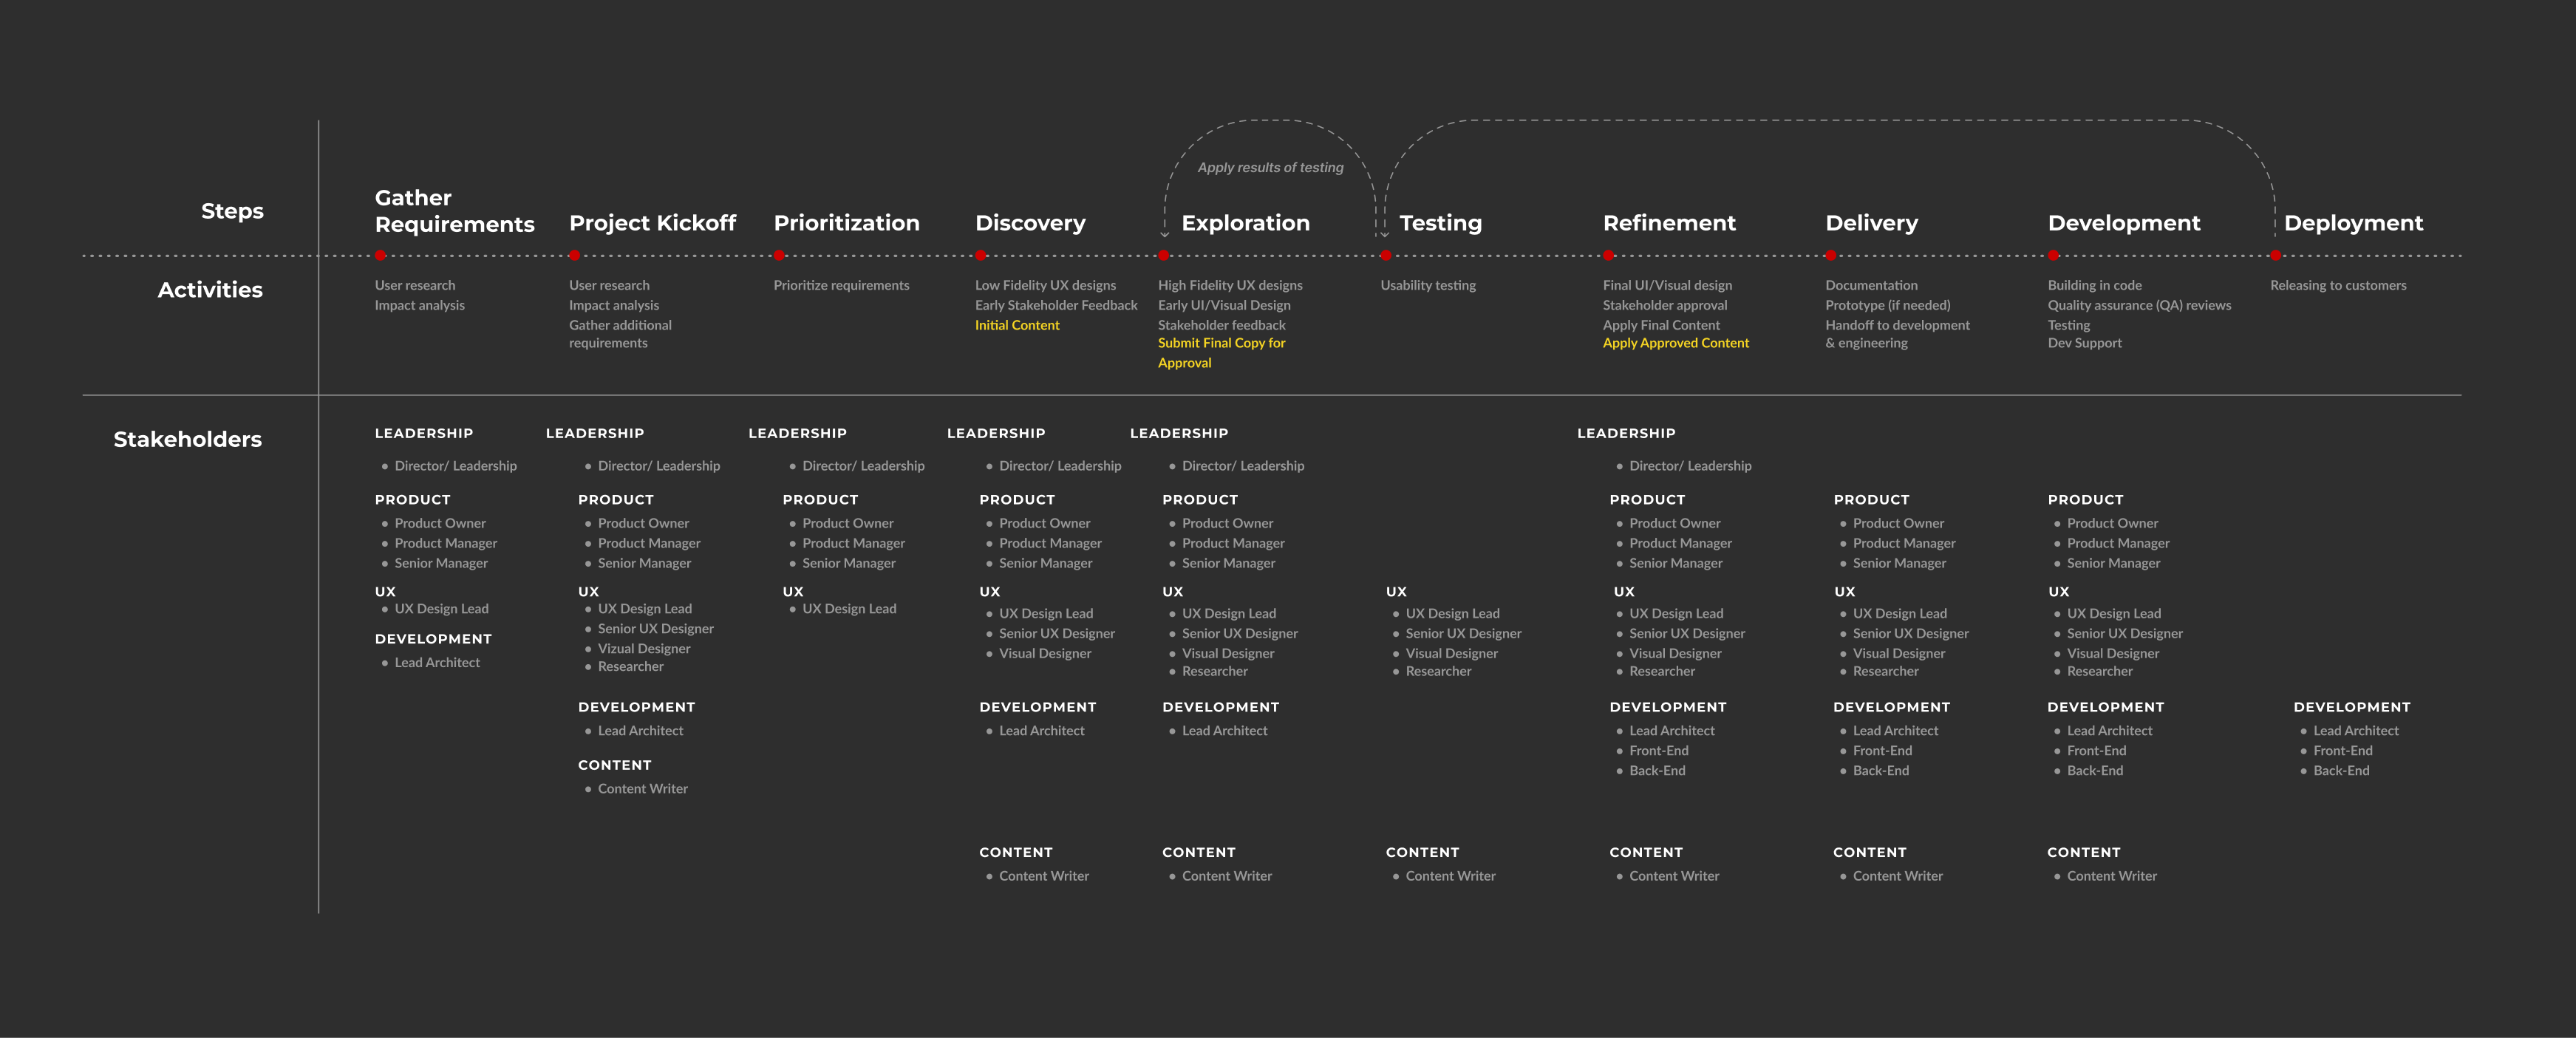
I iterated on more defined steps of the process instead of a visual representation. This new designs is more scannable but I found it really important to highlight what type of step a designer is in. Expanding upon the type of step Shows variables in the stages to get a sense of time estimation, managing possible roadblocks. After speaking to stakeholders they agreed that knowing the type of step could be beneficial along with a more actionable checklist in the activities swim lane.

The stakeholder feedback made path. The number of stages increased, a progression swim line, high level tasks, and contingencies were added to paint a simple picture of the details of each stage. The newest additions are the checkpoints and overlapping checklist items through multiple stages. A checkpoint is an action that must be completed or approved before moving forward.
The final design highlighted stages, overarching goals for the process and design goals for each main goal. It also includes Checkpoints, Process Expectations, and detailed Checklist Items. The use of tags were added to the Checklist items to delineate which item belongs to which department. It was important to note that actions items happen on the backend that influence additional checklist items for designers to follow.
The expectation of this process is for designers to review project status and process checklist during weekly meeting check-ins. Record any yellow or red flags within the design file and communicate issues to all relevant people.


Simple To-Do Figma WidgetThe goal of the map is for designers to follow the process and track where they are in tasks. I collaborated with one of the engineers to build out a Figma Widget for tracking checklist items and the percentage of completion based on the number of tasks.
If you like what you see and want to work together, get in touch!
rebeccanat@gmail.com